|
Demonstrating Scholarship and Effectiveness of Teaching Through the Application of Data Collected from Concept MapsRaymond W. FrancisCentral Michigan Universityraymond.w.francis@cmich.eduAbstract
IntroductionCollege faculty face the dilemma of balancing professional emphasis on student learning with the administrative task of documenting student performance related to reappointment, promotion, and tenure. So how can faculty effectively assess student performance for the purposes of improving student performance, and at the same time generate meaningful data to maintain our academic appointments? The answer may be through the development and use of student concept maps and the development of a focus on the scholarship of teaching. On the student learning side of the equation, concept maps provide a unique pictorial representation of an individual's understanding of a concept, problem, or idea. As tools in the undergraduate and graduate programs of an institution of higher learning, concept maps provide faculty with interesting and effective ways to assess learning by students in all academic areas. Concept maps can give students and faculty meaningful information about student performance. These tools are objective, meaningful assessments through which the instructor can monitor student progress, self-evaluate classroom performance, and revise the delivery of instruction in the collegiate classroom. On the promotion and tenure side of the equation, concept maps provide a true and realistic artefact of student learning and performance in the college or university classroom. These tools allow the instructor to demonstrate student performance and changes in student performance that are directly related to instruction in the college or university classroom. Overview of Concept Maps?Concept maps can take many forms. A concept map presents the relationships among a set of connected concepts and ideas. It is a pictorial way to display how an individual, or group, perceives a concept, problem, or topic. A concept map is constructed, in most instances, from general ideas to more specific ideas. In the following model the main idea (Level 0) located in the oval figure is the most general idea. Level 1 entries, located in the diamond shapes, are linked to the main idea. Links through Level 2, Level 3, and Level 4 are then constructed. Each level out is more specific in content than the preceding level. 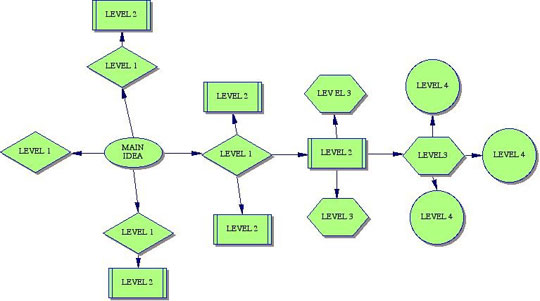
Figure 1: Sample Model of a Concept MapThe preceding model demonstrates a situation where the student has more fully developed one aspect of an idea (links to the right), and has not developed or demonstrated understanding or learning in the other three links. In order to demonstrate learning, the perception exists that a concept map should include multiple levels of entries for all of the Level 1 entries. Brief Research Overview of Concept MapsThe use of graphic organizers as instructional strategies and for assessment of learning is not new. However, the application of the data from student concept maps in the promotion and tenure process is a relatively new idea. Graphic organizers have been used for many years, with published research on the topic including studies from the 1980s, such as Toms-Boronowski's (1983) study linking the improvement of student performance to the use of concept mapping. Margosian, Pascaralle, & Pflaum (1982) demonstrated that students using graphic organizers retained and used vocabulary terms more frequently than students not involved with graphic organizers, and Pittleman, Levin, & Johnson (1985) demonstrated that significant differences in learning and application of major concepts existed between students using graphic organizers and those who did not use a form of graphic organizer in their studies. Applications from early works has grown in many directions. Recent research in the use of graphic organizer includes Health (Tortora, 2002), Business (Novak, 2003), Philosophy (Steup & Sosa, 2005), Teacher Education (Haenisch, 2005; Schön, 1984; Francis 2006), Geography (Strahler, 2005), School Administration (McEwan, 2003), Biology (Crowther & Cannon, 1998), Political Science (Johnson & Reynolds, 2005), Communication (Pehler, 2005), and many others. Recent research into the connection between concept maps and student learning indicates a strong and direct connection. The more students know and understand about a topic, the more detailed and expansive their concept maps become. In addition, the more in-depth a student's understanding of a topic, the greater the number of levels of information reported by the students. These student generated concept maps occur at predictable ratios for each level of the concept map (Francis 2006). Collecting the Data for Promotion and TenureIn almost all institutions where faculty can be promoted or tenured, faculty are asked to submit evidence of scholarly activity and of teaching effectiveness. Teaching effectiveness typically includes some form of student survey and other evidence provided by the faculty member. Concept maps can provide an outstanding source of information for faculty in their efforts to earn promotions and tenure. So, how can the data collected through concept maps be used to demonstrate effectiveness as a teacher in the college or university classroom? The answer is simple and effective. The basic steps include: selecting an expected level of performance for your students, collect your pre-instruction data, teach the unit of instruction, collect your post-instruction data, and analyze the data collected. By selecting an objective performance level for your students, you are identifying a meaningful and clear objective for comparison. Recent research indicates ongoing and consistent relationships between pre-instruction and post-instruction concept maps. In general, pre-instruction concept maps consist of the mathematical proportion of 1:4:3:2 for Level 1: Level 2: Level 3: and Level 4 entries for unfamiliar topics, and a ratio of 1:3:1:0.5 for familiar topics (Francis, 2006). Post-instruction concept map proportions vary directly in relation to the instruction provided in the class. Prior to teaching the "unit of study," ask the students to complete a concept map about the topic. Include a record keeping section that allows students to record the number of Level 1, Level 2, Level 3, and Level 4 entries for their concept map. Transfer the data to a spreadsheet for comparison with the student's post-instructional results. Following all instruction about the "unit of study," ask the students to create a new concept map on the instructional topic of what they have learned from classroom instruction. Students then record the number of Level 1, Level 2, Level 3, and Level 4 entries for their concept map. Transfer this data to a spreadsheet and calculate the growth for each student and as a class. The results can then be reviewed for such things as percent growth in specific levels, overall growth, and connections to the stated objectives of the unit of instruction. An Example from an Undergraduate ClassroomDuring the spring 2007 semester, undergraduate students enrolled in a teaching methods course were asked to participate in the creation and analysis of pre-instruction and post-instruction concept maps. Each student completed a pre-instruction concept map on a new topic, as a part of introducing the topic to the students. Then, following instruction, the students completed another concept map using the same prompt. The number of responses from Level 1, Level 2, Level 3, and Level 4 were recorded. These results were compared with the pre-instruction data and are presented in Chart 1. Chart 1: Spring 2007 Comparison of pre-instruction and post-instruction concept maps
Using the evidence to make the case for student learningAfter collecting and analyzing the data, several things became clear with respect to the direct measure of student learning, and the impact of faculty in the classroom. First, students demonstrated a more thorough understanding of the concept as evidenced by the post-instruction concept map. This indicates a growth in the breadth of understanding the students have about the unit of instruction. They exceeded the expectations initially established as a part of the process. Second, students demonstrated a greater depth of understanding, as evidenced by the increased number of entries in Levels 2, 3, and 4. The class demonstrated their learning through increasing the number of entries at each level related to the assigned topic. It makes sense then to be able to say that the class of students, taken as a whole, grew in their knowledge of the topic and performed at a higher level when comparing the pre-instruction and post-instruction concept maps. As a result of faculty instruction, their overall ability to connect concepts and ideas at various levels grew and expanded. They were able to connect and articulate connections between ideas at a higher level following instruction. In addition, students were able to examine their own growth between the pre-instruction and post-instruction concept mapping events to inform their own learning process. Demonstrating the scholarship of teachingIn a recent publication the comment was made by Burns and Grey (2007) that "The scholarship of teaching means that we invest in our teaching the intellectual powers we practice in our research." That means that we should be exploring our teaching efforts with the same rigor and passion as we explore our research agendas. It is not simply enough to say that our students are learning the materials and performing at an acceptable level. We must use data to demonstrate learning by students and refinement by faculty. This is where concept maps can play a key role. As a direct indicator of student performance related to faculty instruction, the concept map provides that bridge that is essential to examine student learning and faculty performance. According to the data presented in the example, students performed much higher in the post-instruction concept map. This higher performance is expected. However, the key to making the leap to demonstrating the scholarship of teaching is to be able to explain what the instructor did to help these students perform at a higher level. In essence, to demonstrate how the knowledge base and performance of the faculty member contributed to the learning that took place. From the sample data provided, a faculty member could make the claim that their students are learning. They could support the data with a syllabus, sample assignments, sample assessments, and the pre-instruction and post-instruction concept maps. In addition, they would also present a discussion of their approach to teaching, and describe how the activities and their management of the learning environment impacted the students performance. Included with the materials faculty would also review the concept maps for Level 1 terms related to the stated learning objectives of the class. If the students, from a holistic perspective, are not using the key terms and ideas that faculty see as essential, then they should explain how to revise their approach to teaching the topic. This willingness to change, and the knowledge of what to do to change, is the essence of the idea of Scholarship of Teaching. In order to claim that faculty are engaging in the scholarship of teaching, faculty must be willing to share their efforts and discuss their efforts openly and honestly with their eye toward improving their professional practice. ConclusionFaculty seeking to promote high levels of student performance and to document efforts related to promotion and tenure should consider the use of concept maps as an effective and meaningful source of data. Concept maps represent authentic views of undergraduate knowledge, and changes in concept maps can be shown to be a direct result of instruction in the undergraduate classroom. The system for generating, collecting, analyzing, and presenting data related to concept maps is easy to use and yields a variety of data for the instructor. In short, the use of concept maps allows the instructor to take back control of a portion of the promotion and tenure process in a way that is directly related to student learning, faculty performance, and the professional knowledge base of the faculty. How we, as faculty, use these valuable tools, and the data they contain, allow us to truly move into that realm representing the scholarship of teaching. References
Bender, E & Grey D. (2006). The Scholarship of Teaching. Research and Creative
Activity. Indiana University Graduate School website. Referenced on May 1, 2007. URL
address: http://www.indiana.edu/~rcapub/v22n1/p01.html
Please cite as: |