|
Engaging Academics with a Simplified Analysis of their Multiple-Choice Question (MCQ) Assessment ResultsGeoffrey T. CrispUniversity of Adelaidegeoffrey.crisp@adelaide.edu.auEdward J. PalmerUniversity of Adelaideedward.palmer@adelaide.edu.auAbstract
IntroductionSummative assessments are a high stakes activity for both students and teachers. For students, the results from a summative assessment may determine what pathways are available to them in the future, and for teachers, the results are often subject to scrutiny by examination boards or used in benchmarking studies. In the future, the ability of universities to justify the quality of their assessment tasks in potential legal actions taken by disaffected students may also be necessary. Terms such as validity and reliability are frequently used in relation to assessment quality, yet many academics would be unsure how to measure these characteristics for their own assessment tasks despite the significant literature base on how to apply psychometric principles and statistical tools (Mislevy, Wilson & Chudowsky, 2002). The design principles for preparing quality assessment tasks in higher education have been well documented (Biggs, 2002; Bull & McKenna, 2003; Case & Swanson, 2001; Dunn, Morgan, Parry & O'Reilly, 2004; James, McInnis & Devlin, 2002; McAlpine, 2002a; PASS-IT). There is also an extensive body of work in the discipline of validity and reliability testing for assessments and there are numerous descriptions that are readily available for academics on how to apply both psychometric principles and statistical analyses based on probability theories in the form of Classical Test Theory and Item Response Theory, particularly the Rasch Model (Baker, 2001; Downing, 2003; McAlpine, 2002b; Wright, 1977). Thus, there is no shortage of literature examples for academics to follow on preparing and analysing selected response questions; academics and academic developers should be in a position to continuously improve the quality of assessment tasks and student learning outcomes. However, the literature evidence for academics and academic developers generally using these readily available tools and theories is sparse (Knight, 2006). Academics are generally not specialists in the research discipline of assessment, and they do not routinely analyze their assessments using the accepted standards associated with validity and reliability. Academics tend to rely on the accumulated discipline-based history about what constitutes an acceptable assessment standard, rather than attempt to apply quantitative principles from another discipline, especially if there is uncertainty about how to apply these principles appropriately. The key validation tool for the majority of assessments tends to rely on academic acumen rather than quantitative evidence (Knight, 2006; Price, 2005). An analysis of the assessment in terms of acceptable standards of validity and reliability, as well as improvements that could be applied to the individual question items, their relative importance in an assessment and their ability to align with the stated objectives for the course, could lead to improvements in student performances. This analysis is particularly important for selected response items since they tend to be reused, either directly in subsequent years, or by rotating questions every few years. This is a common occurrence in academic practice, but is based more often on the time convenience afforded by the reuse of previously prepared questions, rather than a scholarly judgement about the efficacy of the question in discriminating between those students who have mastered concepts well and those who have not. Academic development units could assist in this endeavour by undertaking a routine analysis of assessment items using simple spreadsheet or database tools and preparing reports for academics that highlight the key issues that require attention, at least from the perspective of validity and reliability. This process could be used by academic developers to engage academics in the broader issue of using formative assessment to improve learning. Questions that have been shown to have good discrimination characteristics could be used during the learning stages, rather than just as discriminators in summative assessment tasks. Engaging academics with the analysis of assessment items is a potential pathway to engagement with methods to improve student learning, highlighting the importance of diagnostic and formative assessment coupled with appropriate feedback. It could be argued that academics preparing high stakes summative assessments should develop the skills required to analyze the results of their assessments, but the reality often encountered in higher education institutions is that academics do not have the time, nor the incentives in place to allocate the time required to master these skills. By accepting that this situation is prevalent in most higher education institutions, the authors have proposed a relatively simple analysis and presentation format for reports on student assessment responses that academics could use to make judgments about their assessment tasks. We further posit that academic developers could then use these simple formats to engage academics in a discussion about the efficacy of using questions with particular characteristics in diagnostic and formative assessments in order to improve student learning outcomes. Descriptions of basic and more sophisticated approaches to item analysis for academics have been reported but do not provide an adequate visual engagement component that would allow time-poor university staff to quickly determine the salient issues for a particular assessment (Kehoe, 1995; Maunder, 2002; Fowell, Southgate & Bligh, 1999).
MethodologySurvey on Analyzing Assessment Response and ResultsWe conducted an online survey of academics, predominantly from our Graduate Certificate in Higher Education program and the compulsory foundation program in university teaching. These groups were selected as they had recently been engaged in intense discussions about the relationship between assessment practices and student approaches to learning, and the importance of evaluation and reflection in the context of the scholarship of learning and teaching. The goals of the survey were to obtain feedback on participants' use of objective assessments, their awareness of psychometric principles and their knowledge of the statistical tools available for the analysis of student responses. Presentation formats illustrating different methods of reporting the analysis of multiple-choice question (MCQ) responses were discussed and the results from a number of MCQ tests for several disciplines were analyzed. Rasch analysis results, the use of the facility index, the discrimination index, the effectiveness of distracters and an item-person map analysis were all presented to the academic staff as valid analysis tools. The Rasch analysis and item-person map were generated using WinSteps®. All other data were presented using Excel's graphing tools. Forty-five staff in total from across all major discipline types, including participants in the Graduate Certificate and foundation university teaching programs, and some staff known to be using MCQ assessments for large introductory classes, were contacted by email and invited to fill in the online survey.
Results and DiscussionWe received twenty-one valid responses from the online survey (47% response rate), 77% indicated that they used MCQ assessments and 38% had undertaken some form of analysis of the student responses. The results of the awareness and usage of psychometric principles and statistical tools for the analysis of MCQ assessments and their responses are summarised in Table 1. Academics were familiar with common statistical terms such as mean, median, standard deviation and percentiles. Some were familiar with the different types of terms used to describe validity, but very few were aware of the formal psychometric approaches associated with Classical Test Theory, the Rasch Model or Item Response Theory (Table 1).
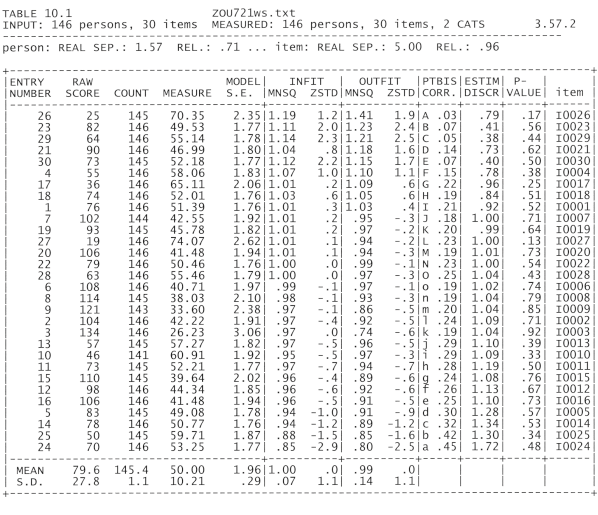
Table 1: Summary of Academic Staff Responses to Awareness and use of Psychometric Principles and Statistical Tools for the Analysis of MCQ Response. Only half of the respondents using MCQ assessments undertook some form of analysis of the student responses beyond simply reporting the student scores. Only 14% of the respondents who analyzed the student responses indicated that it influenced their teaching of the course, although 81% of all respondents indicated that an analysis of the student responses would be useful. Of the staff who analyzed their MCQ student responses, the mean (100%), median (88%), standard deviation (88%) and percentile (50%) were the most common properties used, reflecting a similar pattern to that observed for the whole group for the recognition of psychometric principles and statistical tools. Only one or two individuals used Classical Test Theory, the Rasch Model or Item Response Theory for analysis. As part of the online survey, we presented academics with four different output file styles from both WinSteps® (Figure 1) and Excel. Table 2 summarizes the staff responses. The majority of staff found the presentation format for the output from a standard WinSteps® report not to be useful, although they were aware that it contained useful information that could be used to improve staff approaches to teaching. Typical open-ended comments from the survey responses for the standard WinSteps® format were:
Too complex for my needs and understanding
Figure 1: WinSteps® Output for a MCQ Summative Test
Table 2: Summary of academic staff responses to awareness and use of psychometric principles and statistical tools for the analysis of MCQ responses. We have proposed a number of simple presentation formats for MCQ analysis reports that we believe highlight the key features that academics should engage with, and which will have a positive impact on staff teaching and student learning. From our discussions with academics in our graduate certificate and foundation teaching programs, we were aware that academic development units will have more impact if they provide information to staff in a simple, easily understood format, rather than solely concentrating on development workshops or seminars of a general nature (Prebble, Hargraves, Leach, Naidoo, Suddaby & Zepke, 2005; Prosser, Rickinson, Bence, Hanbury & Kulej, nd).
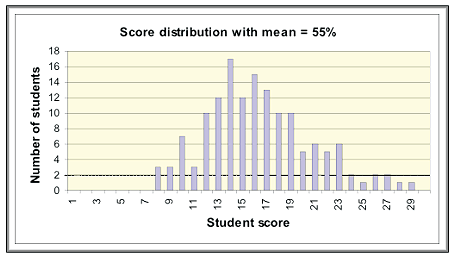
Score DistributionThe score distribution and overall mean score from our WinSteps® example is shown in a column graph format in Figure 2. McAlpine (2002a) and Johnstone (2003) have suggested that an acceptable mean mark across assessments conducted in norm-referenced modes should be between 50-60%, indicating that on this basis at least this MCQ assessment was acceptable. We can see immediately that the distribution is centred approximately as expected for this norm-referenced activity, and that the minimum scores are above that apparently expected from purely statistical guessing. Burton & Miller (1999) and Burton (2001) have described methods for quantifying the effects of chance on the '50/60% overlap' score region, and have shown that the impact of guessing correct responses in 4 and 5 option MCQ tests can reduce test reliability significantly. Without the use of negative or confidence level marking (McCabe & Barrett, 2003), it is difficult to separate purely statistical guessing from 'informed guessing'.
Figure 2: Score Distribution for a MCQ Summative Test, Consisting of 30 Items with 5 Options Each, Undertaken by 146 students.
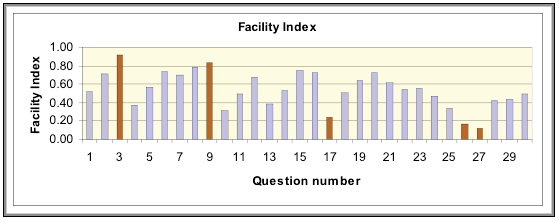
Facility IndexClassical Test Theory (McAlpine, 2002b) can be used to determine a facility index (FI) for each item in the test. The FI indicates how many students chose the designated correct response compared to those who chose other options (or distracters), and is expressed as a fraction. Johnstone (2003) and McAlpine (2002b), have suggested that academic staff should aim for a FI of between 0.3 - 0.8 for each question. Figure 3 illustrates a column graph showing the FI for each item in our 30-question MCQ example. Academic staff should be made aware of any question which returns a FI outside the suggested 0.3 - 0.8 range (as indicated by the darker shading in Figure 3). FI values for items that are above 0.8 indicate that most students selected the designated correct response to the item, whilst FI values below 0.2 indicate that only a few students chose the correct response. We can see that questions 3 and 9 had a FI above 0.8 and questions 17, 26 and 27 had a FI below 0.3. This does not automatically mean that these questions should be removed from the assessment, or that they were inappropriate questions. For academic staff the priority would be to review these questions in particular and decide if they were consistent with the stated objectives for the assessment and allowed students to demonstrate learning and skill development. Difficult questions may have been intentionally incorporated into the test.
Figure 3: Facility Index Graph for the Example MCQ Summative Test. The order in which questions are presented in a test has been shown to have minimal influence on the overall scores obtained by students (McLeod, Zhang & Hao, 2003). Questions may be arranged according to topic, similarity of concepts, difficulty order or simply at random. In order to assist students in gaining confidence in answering questions it is often beneficial to commence with relatively 'easy' questions, and gradually increase the difficulty level as the test proceeds (Clariana & Wallace, 2002; Haladyna, Downing & Rodriguez, 2002). We can see from Figure 3 that the FI values tended to decrease for the second half of the 30 questions, although the trend is not uniform. This is useful information for academic staff who may wish to arrange questions in a particular order.
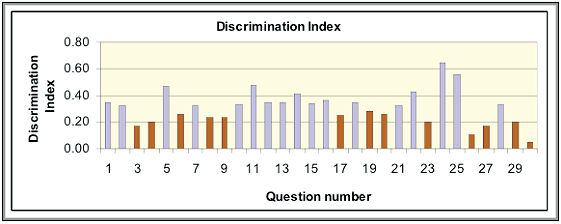
Discrimination IndexThe discrimination index (DI) is another very simple indicator that may be used to measure the ability of a question to differentiate between high and low achieving students (McAlpine, 2002b). The DI for each question can be calculated by subtracting the FI for each question for the bottom third of the class from the FI for each question for the top third of the class (ranked according to their overall score on the assessment). There are more sophisticated methods for calculating the DI but the method described here is simple and useful for most academic staff in universities (McAlpine, 2002b). The DI may range from 1.0 to -1.0, with 1.0 being a perfect correlation between students selecting the correct response and also scoring high marks on the test and -1.0 being for questions where students answered incorrectly but scored highly overall. Typical values recommended for the DI value are above 0.3 (Johnstone, 2003 and McAlpine, 2002b). In Figure 4 we can see that all questions in the test had a positive DI, meaning that students who answered each question correctly, also scored more highly overall. However, many of the questions had DI values below the suggested 0.3, indicating that they did not allow much discrimination between students, since high achieving and low achieving students answered the questions equally well. In particular, we can see that questions 26, 27, 29 and 30 had low DI values but appeared at the end of the test, a position where more difficult and discriminating questions might have been expected. Questions 26 and 27 have both a low discrimination and facility index, suggesting that these questions may not be appropriate.
Figure 4: Discrimination Index Plot for the Example MCQ Summative Test Figure 4 was presented as part of the staff online survey, and Table 2 indicates that a significant majority of the participants found this presentation format useful. Open-ended comments from staff included the following, with the first comment likely indicating a misunderstanding of the use of the DI:
This would help me see which questions were difficult and easy and match that to the learning objective.
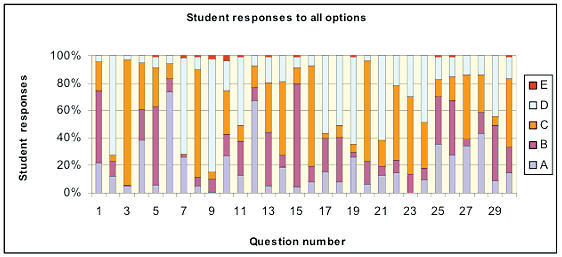
DistractersDistracters (incorrect responses) are designed to differentiate students who have learnt the material from those who have not. Useful distracters would normally cover a known misconception experienced by previous students, and factual errors that are familiar to the teacher, and should have a student response value of at least 20-30% for each distracter. It is wasteful of the academics' and students' time to add distracters to an item that have very low student response values. The example data provided here were based on a series of 5 option MCQs consisting of one key and 4 distracters. Figure 5 illustrates how students responded to each of the options in the assessment, shaded differently for the responses A, B, C, D and E. This representation provides teaching staff with a significant amount of useful data. A quick visual inspection informs us that option E is underrepresented. This would imply that the assessor has not used E as a key for many questions, or that thinking up 5 options was difficult and E was usually assigned to an option that was not as plausible as the other options. For each question, the percentage of responses for each option can be visually determined by examining the extent of the shaded bar. If assessors have decided to commence the assessment with easier items, and gradually increase the level of difficulty of items as the test proceeds, then items in the second half of the assessment would often be expected to have a more even distribution of student responses to each option, assuming that later questions have a higher DI for each option. The shading pattern in Figure 5 would be expected to change as we proceeded from left to right. This type of quick visual overview enables academics to focus on key issues for their assessment structure and the resulting outcomes. Thus for question 3 we can see that students did not choose the distracters over the key often. This is the type of question that the academic should review for the efficacy of the options. Questions 25-30 all have good selections across all options. This may mean that the options were testing known misconceptions, or that students had little idea what the correct response should be; the DI correlation could then be used to determine whether high achieving students were choosing the key.
Figure 5: Student Responses to all Options for the Example MCQ Summative Test. Figure 5 was presented to academic staff as part of the online survey, and received mixed responses as to its usefulness with an equal split between those academics who found it helpful, and those who were not clear what it represented (Table 2). Some of the open-ended comments from survey participants included:
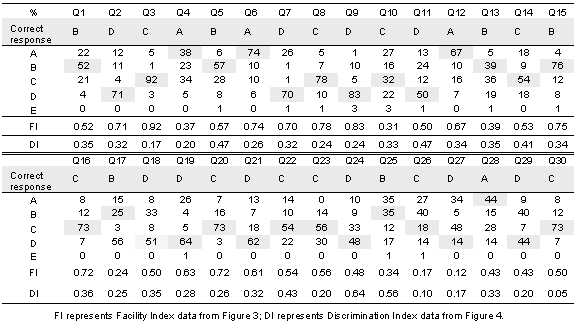
Too complex for my needs and understanding. Academics often have different preferences for the way material is presented, just as students have different preferred learning styles. The data presented in bar graph format in Figure 5 could also be presented as a table, with the percentage responses to each option and an indication of the key for each item (Table 3). The information contained in Figure 5 or Table 3 could be used by either academics or academic developers to not only improve the items in this particular assessment, but also to develop diagnostic and formative assessment tasks that could potentially improve student learning. Items that display good DI values could be used early in the teaching period as formative tasks that direct student learning by providing appropriate feedback. This process of identifying assessment items with good discrimination characteristics could be used proactively by academics to improve student learning on an iterative basis.
Table 3: Summary of student responses to MCQ assessment as outlined in Figure 5.
Reliability and ValidityHow does an academic know if the overall assessment is valid and reliable? A valid assessment is one that measures what it professes to measure; a reliable assessment is one that would produce similar results over a period of time when used by students of similar ability and in the same circumstances. The most common measure used for internal consistency within a single test is the correlation between items using a Cronbach's Alpha (a) coefficient of reliability, and although there have been discussions in the literature over whether this single measure is a true indicator of reliability for MCQ assessments (Burton, 2004), when used in conjunction with the other data suggested in this paper, it will give academic staff a reasonable summary of a particular assessment. McAlpine (2002b) has suggested MCQ assessments should aim for an a of approximately 0.70. The WinSteps® data from our example indicate an a of 0.69 and this can simply be presented as a numerical value to academic staff.
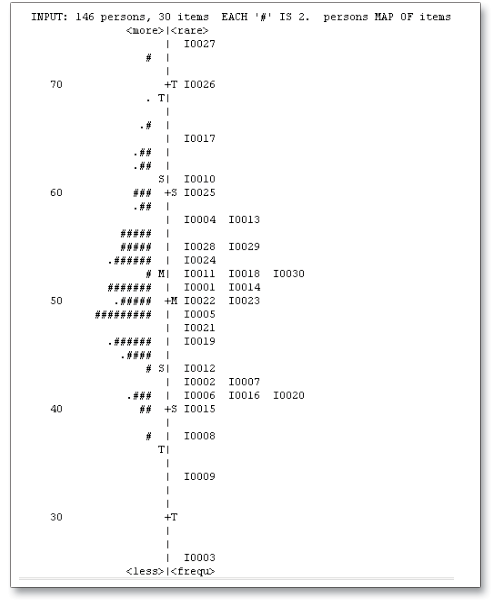
Overall summary of MCQ assessmentFigure 6 illustrates the person-item map from a WinSteps® output for our MCQ assessment example. This shows the distribution of scores as a percentage on the left (similar information to that presented in graphical format in Figure 2), with groups of 2 student scores indicated by a # and 1 student score represented by a period(.). The question (item) number appears on the right hand side (where I0003 represents item 3), arranged with the easiest (highest FI values) on the bottom and the most difficult (in this example item 27 represented by I0027) on the top. The letter M indicates the position of the mean, S one standard deviation from the mean and T indicating two standard deviations from the mean. It can be seen that questions 3, 8 and 9 were answered correctly by most students since they are more than one standard deviation away from the mean (M and S on the right hand side), and academics could decide whether these question are relevant in a norm-referenced assessment. Questions 10, 17, 26 and 27 were quite difficult, and again academics could decide if this was appropriate.
Figure 6: Student Responses to all Options for the Example MCQ Summative Test in the Form of a Person-Item Map. The purpose of this diagram is to provide academics with a visual summary of both the performance of the class as a whole (from the distribution of scores on the left hand side) and the level of difficulty of each question, all on one diagram. The distribution of student scores and difficulty level of items along the vertical axis provides a visual check on unexpected distribution patterns. The same information can be presented as individual tables of figures, or as separate bar graphs, but the advantage of the person-item map is that is presents in a relatively simple manner a large amount of analytical data. Such data presentation could be undertaken by academic development units as a service to areas using MCQ assessment items. By providing this service, academic developers would be in a position to engage academics in the broader discussion about their assessment strategies, especially the use of diagnostic and formative assessment for improving student learning. These discussions would be framed with an evidenced-based approach and academics would be able to track the efficacy of their activities. Figure 6 was presented in the online survey and overall was regarded as useful by the majority of participants, although not all thought it would assist them (Table 2). Open-ended comments from academic staff about this presentation format included:
Helpful in visually seeing questions that really made students think. Perhaps this could be designed to be more visual - colour?
SummaryIt is common practice for academic staff to set an assessment, mark it, report the students' scores and then give the assessment no further thought until the next iteration of the cycle. This is understandable when academics are pressured to report students' scores as soon as possible so that grades and graduations can be finalized and other activities such as research and new course designs continually demand attention. Academics participating in our graduate certificate and foundation teaching program have indicated that academic development units could assist them by preparing appropriate reports on the analysis of the student responses and scores from their assessments in a succinct and visually engaging manner. They are prepared to allocate time to reflect on student responses and how they could improve their teaching and assessment designs. What they require are reports that can be quickly interpreted and where the issues that will have the greatest impact on student performance or outcomes are highlighted. Academic developers could further use the process of presenting the results of a MCQ assessment analysis to engage academics in the use of specific items for diagnostic and formative assessment, thus providing an evidence-based pathway for the improvement of student learning. We have presented a series of simple visual representations of psychometric or statistical data derived from the analysis of MCQ assessments as a first stage in this reporting process. We are not proposing that the particular formats presented in this paper are necessarily ideal. There are many adaptations that may highlight the key features arising from student responses more effectively, but what this paper has demonstrated is that academic development units need to reflect on how they may assist academics to improve student performance and learning outcomes in a practical way. Presenting academics with simple (but not simplistic) analytical tools and easily understood frameworks will facilitate engagement with the underlying theoretical and pedagogical issues related to assessment and student learning.
References
Baker, F. B. (2001) The Basics Of Item Response Theory. Retrieved from: http://edres.org/irt/baker (accessed 6 December 2007).
Please cite as: |
|||||||||||||||||||||||||||||||||||||||||||||||||||||||||||||||||||||||||||||||||||||||||||||||||||||||||||||||||||||||
